 by
by In this tutorial, you will learn how to build a Table report using Reports Builder and publish the report to the Report Server. Then we’ll access this the report on a web page using the Web URL we set up in Part 1.
- Install and Launch Reports Builder
- Create a Data Source
- Create a Dataset
- Design a Table Report
- Publish Your Report to the Web
1. Install and Launch Reports Builder
In the Part 1 of SSRS Tutorial, we setup SSRS Server and configures SSRS. In this tutorial, we would install Reports Builder and actually build reports.
Follow the steps below:
Download and install MS Report Builder from the link.
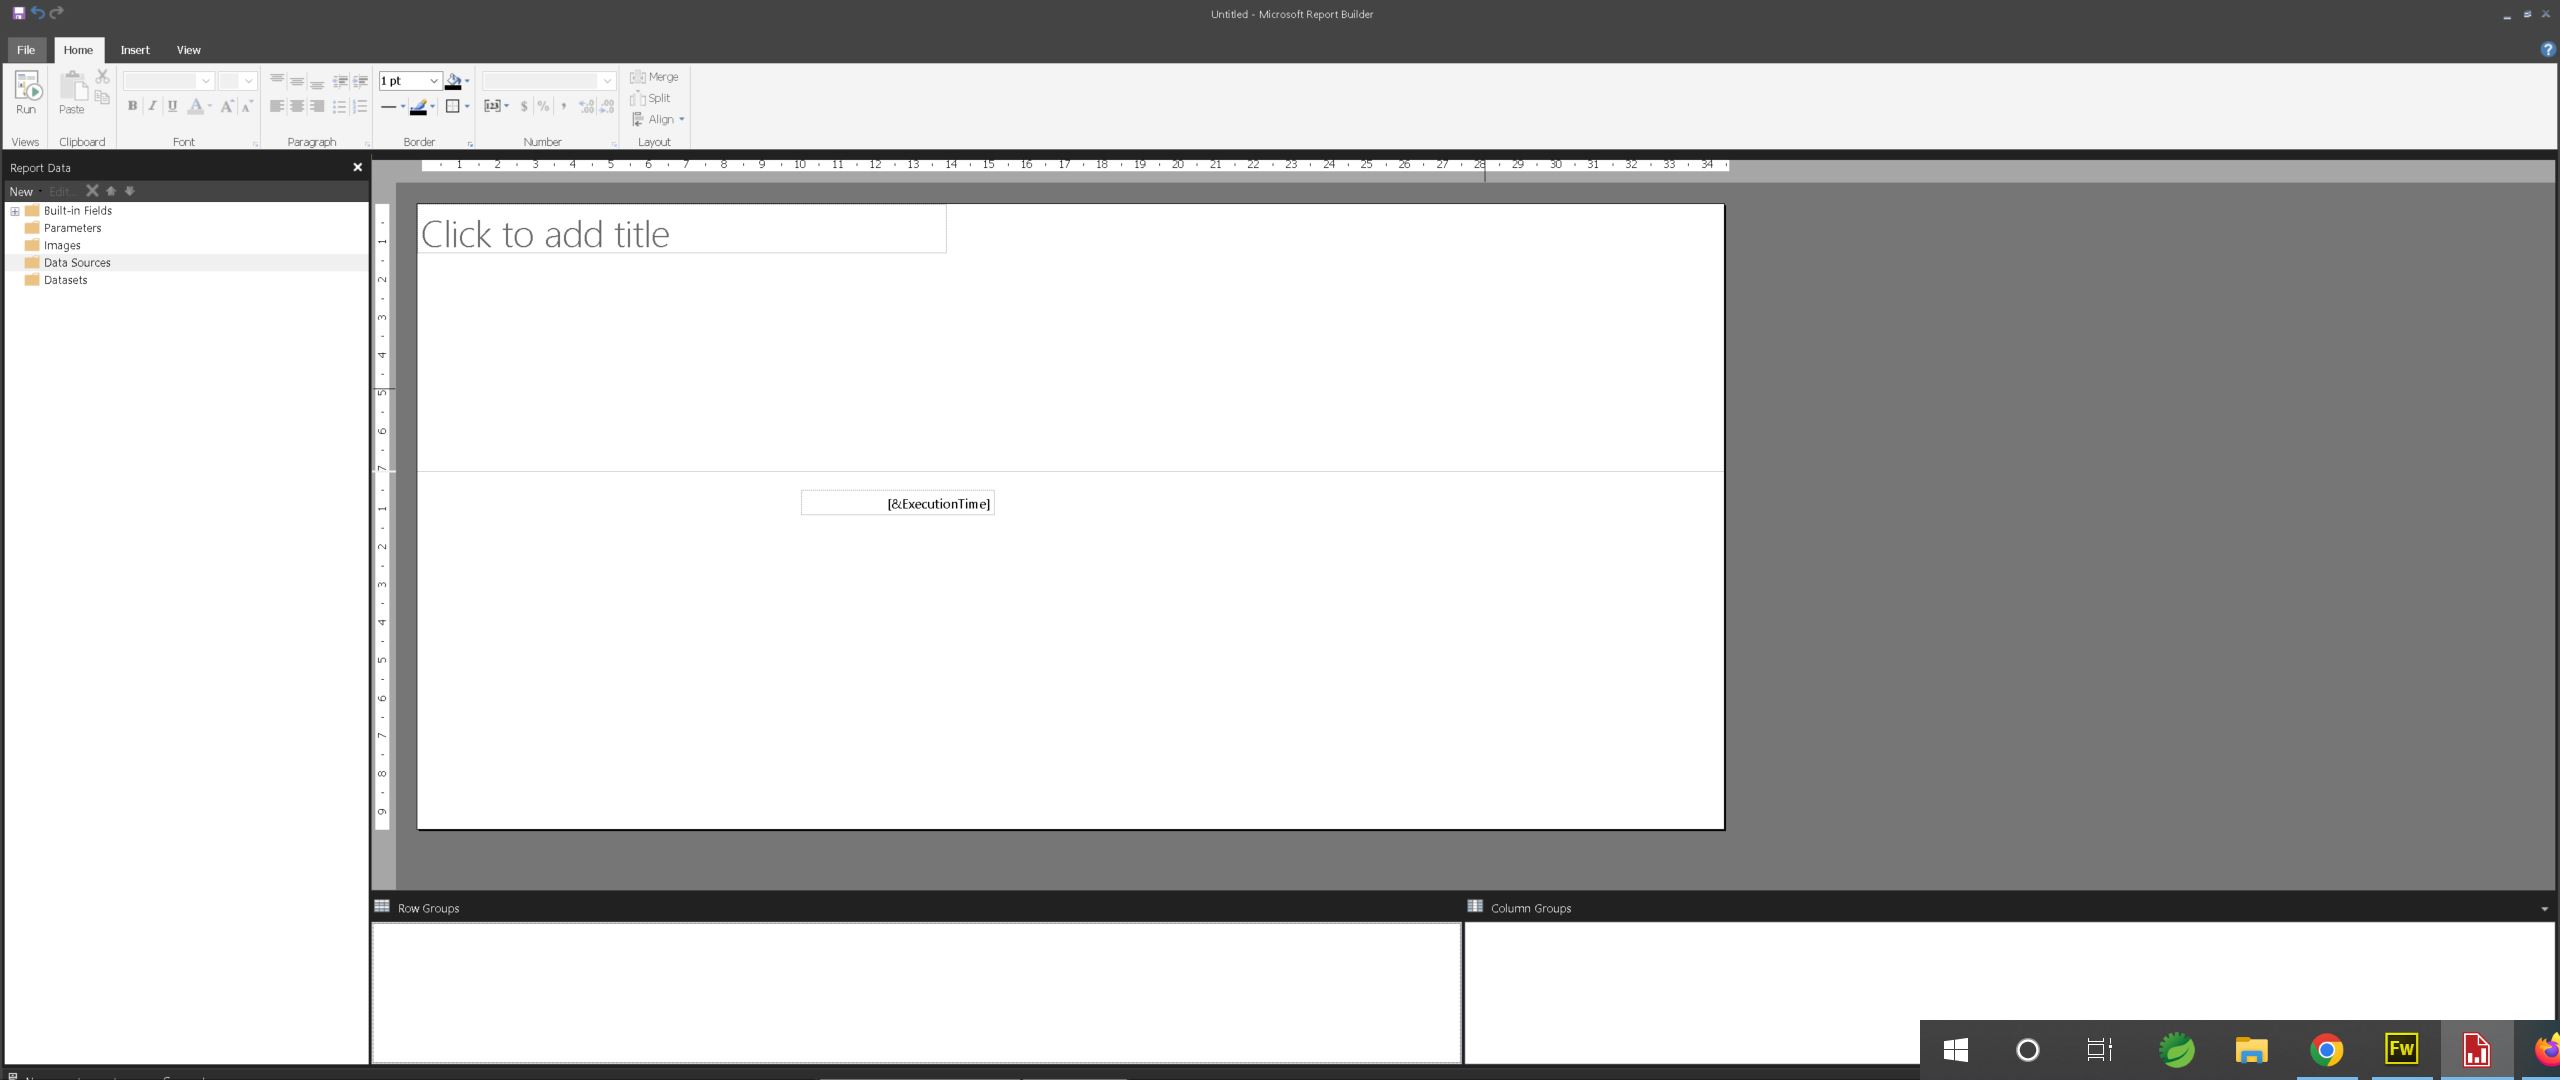
After installation, launch Reports Builder and you will have the window below:

Click on the Close(x) icon to exit this window.
At this point, you will see an empty reports page as shown below.
2. Create a Data Source
Before you can create a data source, you must have some data in a database. In this tutorial, we would using the Northwind database. This is a free database you can add using Management Studio (see the video on how to do this).
Follow the steps below to create a data source
Step 1 – Right-click on Data Sources and choose Add Data Source. The Data Source properties window opens. Modify as shown below (you can watch the video for if you need more details on this, but it’s quite easy)
I named it MyDataSource

Step 2 – Click on Ok to close the window
3. Create a Data Set
Next we need to create a dataset.
Step 1– Right-click on Datasets and select Add Dataset The Dataset properties windows opens up as shown in the figure
Step 2 – Adjust the settings as shown:
- give it a name,
- Select ‘Use a dataset embedded in my report,
- Select your Datasource under Data Source

Step 2 – Click on Query Designer to open the query designer as shown below in the Figure below:
Step 3 – Expand Tables and select Customer

Step 4 – You can click on Run Query to see the query results
Step 5 – Click on Ok to exit the Query designer
Step 6 – Click on Ok again to exit the Dataset properties window
4. Design a Table Report
Now we would design a Table report using our dataset
Step 1 – Give your report a title by replacing the text “Click to Add Title”
Step 2 – From the Insert tab, choose Table -> Table Wizard. The table wizard window opens as shown

Step 3 – Click on MyDataset and click Next

Step 4 – Select all the fields and drag them to the Values section
Step 5 – Click on Next -> Next again and Finish. Your report would now appear with your table as shown below:

Step 6 – Click on Run to preview the report. You will see a list of Customers displayed. Then you can go back to design view.
Step 7 – Click on File Save as to save the report with a name. I named it Customer. It’s a .rdl file.
Take note of the location you are saving it.
5. Let’s Publish Our Report!
Now we must publish our report so that we can access it on the web. Follow the Steps below
Step 1 – Open the Report Server Configuration Manager
Step 2 – Click on the Web Portal Url. Click on the link to open the url on a web browser.

Step 3 – Click on the Upload button and select the report you saved earlier. You Customer report shows up as a link.
Step 4 – Click on the link to run the Report. You will see the list of customer displayed on the web page.
if you have come this far, thumbs up! You have created your first report in SSRS. In the next tutorial, you will learn how to improve your reports and add summaries.
Feel free to visit my YouTube Channel for video tutorials.
Want live SQL Server and BI classes? Join Alkademy for instructor-led database administration and business intelligence courses.
User ” does not have required permissions. Verify that sufficient permissions have been granted and Windows User Account Control (UAC) rest
i get this error google chrome