 by
by In a packaging plant, a machine packs cartons with jars. It is supposed that a new machine would pack faster on the average than the machine currently used. To test the hypothesis, the time it takes each machine to pack ten carons are recorded. The result in seconds is as follows.
| New Machine | Old Machine |
| 42.1 | 42.7 |
| 41 | 43.6 |
| 41.3 | 43.8 |
| 41.8 | 43.3 |
| 42.4 | 42.5 |
| 42.8 | 43.5 |
| 43.2 | 43.1 |
| 42.3 | 41.7 |
| 41.8 | 44 |
| 42.7 | 44.1 |
Do the data provide sufficient evidence to conclude that, on the average, the new machine packs faster? Perform the required hypothesis test at the 5% level of significance.
Solution Steps
Download the excel sheet for this excercise for free
Just as before, we need to try to understand the question clearly so we can set up the null hypothesis and the alternate hypothesis.
Note the following points about this question
- there are two samples given
- two scenarios needs to be compared
- note this statement in the question: ‘it is supposed that…’. That gives you the null hypothesis
- two means need to be compared
Quiz: What type of test do you think would be used?
Answer: Independent Samples t-test
Step 1: Set up the null hypothesis and the alternate hypothesis
H0: μ1 ≠ μ2
Ha: μ1 = μ2
Note: The null hypothesis says that the new machine is better. If this is the case, then the mean of the two samples would not be equal. That is the null hypothesis
Step 2: Calculate the means of the two groups
Create a table like the one below and use it to calculate the means of the two groups. You can also calculate the means by hand.
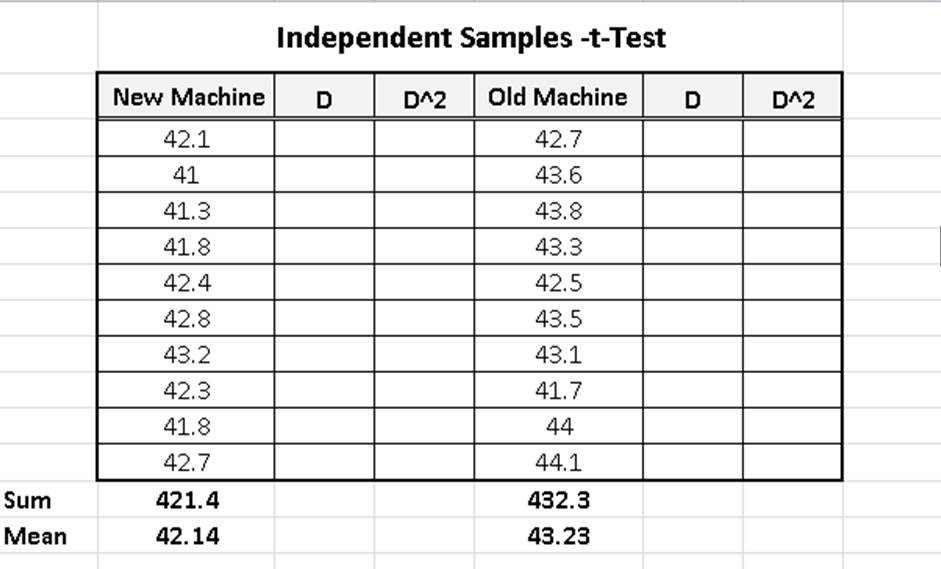
Watch how to easily create this table using MS Excel
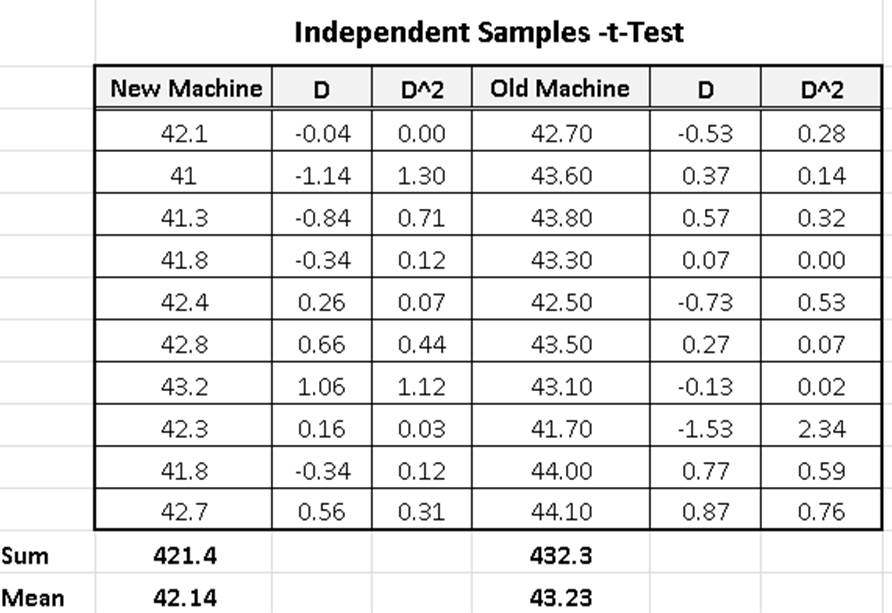
Step 3: Calculate the Differences and the Square Differences
The difference is gotten by subtracting the mean from each of the values.
That is for i = 1 to n, calculate xi – m
where m is the mean of the sample
Then you square this values as well.
If you have done this correctly, the excel sheet would be as shown in Table 2
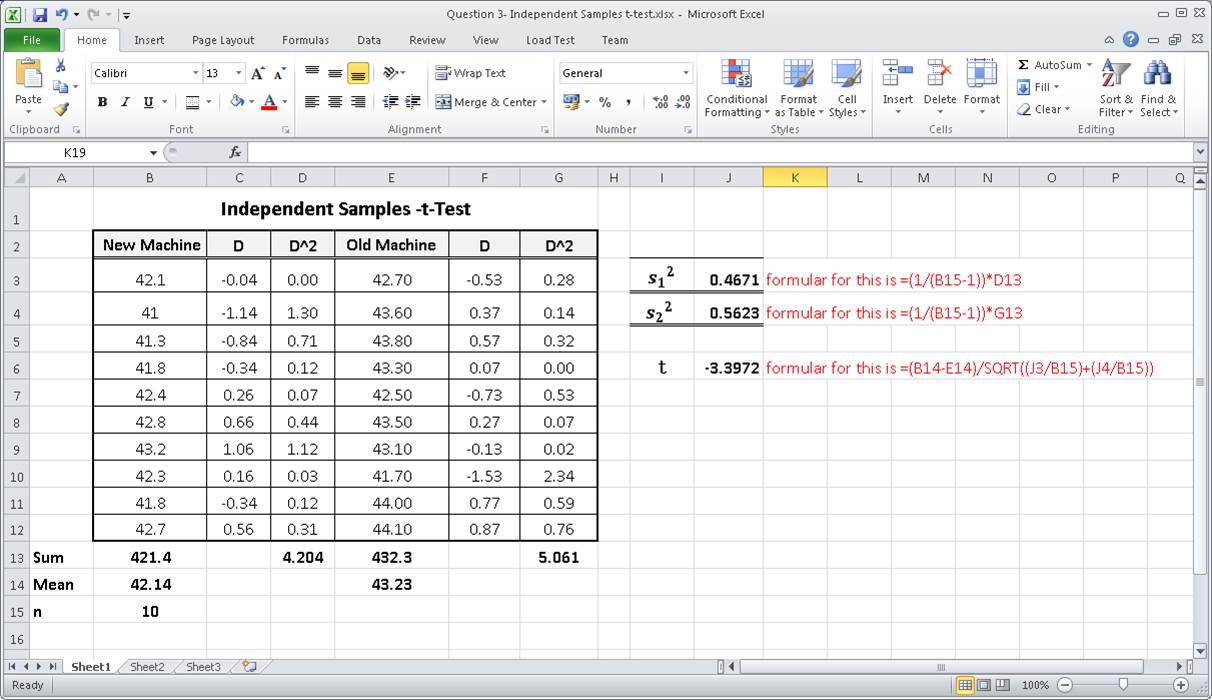
Step 4: Calculate the Variance for each group
The formular for standard deviation is given as:
Note that variance is the square of the standard deviation
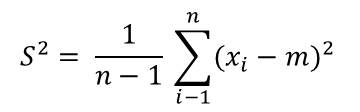
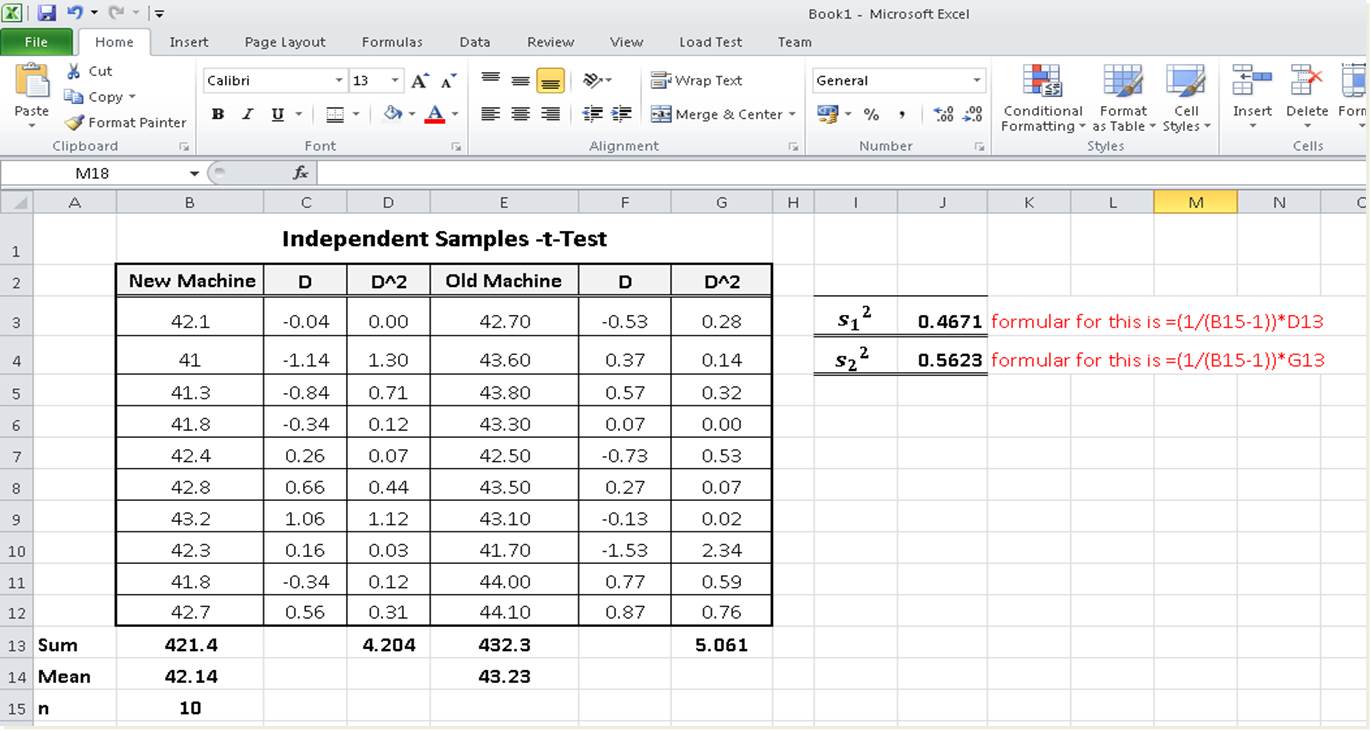
This formula is quite simple. It means that you need to calculate the sum of the squared differences (or deviations) and divide by n-1. We already have this column in our table(as D^2). So we simple take the sum of this coulmn.
Do this for the two groups to get s1 and s2
The tabe would the be as shown in Table 3.
Step 5: Calculate the t-statistic
Using the data from the table in step 2, calculate the t statistic using following the calculation steps.
All the values you need are in the Table 3.
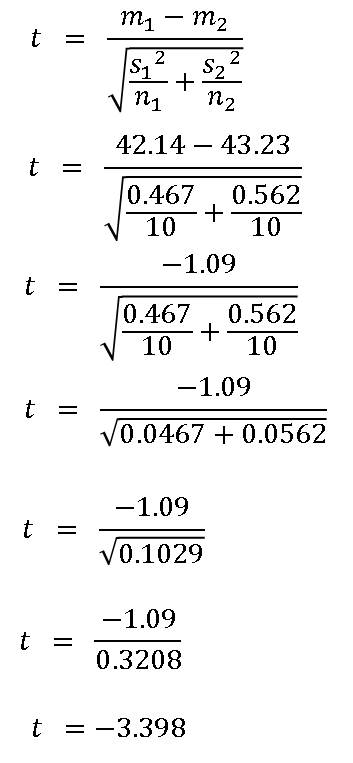
Finally we have it!
This value is called the calculated t statistics (or the absolute value of t, since we would not consider the negative sign)
The hint to getting used the t-statistic formula is to write it a couple of times on paper until you can write it without looking at this page.
The final excel sheet is shown in Table 4 (Download this sheet from here)
Get the statistical table from here
Check the critical value for t in the statistical table. This value from the table called written as Kα
To look this up we need the degrees of freedom and the alpha
degrees of freedom(df) = n1 + n2 – 2 = 10 + 10 – 2 = 18
α = 0.05
K0.05 = 1.7291
Step 7: Draw the conclusion
Compare the two values: the calculated t value and the value of t from the statistical table.
Since the absolute value of the t statistic (calculated) is greater than the critical value, we reject (or fail to accept) the null hypothesis.
We then conclude that there is significant difference in the two means and that the new machine is signicantly faster than the old one.
Download the excel sheet for this excercis for free

this is helpful .
This exercise it may be not completely correct because the hypothesis says that:
H0: μ1 ≠ μ2
Ha: μ1 = μ2
Note: The null hypothesis says that the new machine is better. If this is the case, then the mean of the two samples would not be equal. That is the null hypothesis
And in the conclusion we reject the null hypothesis.
But then conclude that there’s significant difference in the two means
Hmm! Makes sense!
we have to change the null hypothesis.
I think I agree with you
i think if the means ot two samples are equals means that there is no difference between the two machines (old and new ) and if the means are not equals means that performance of two machines are not same but i am not sure if we can say that one of them is faster than the other , can we ?