 by
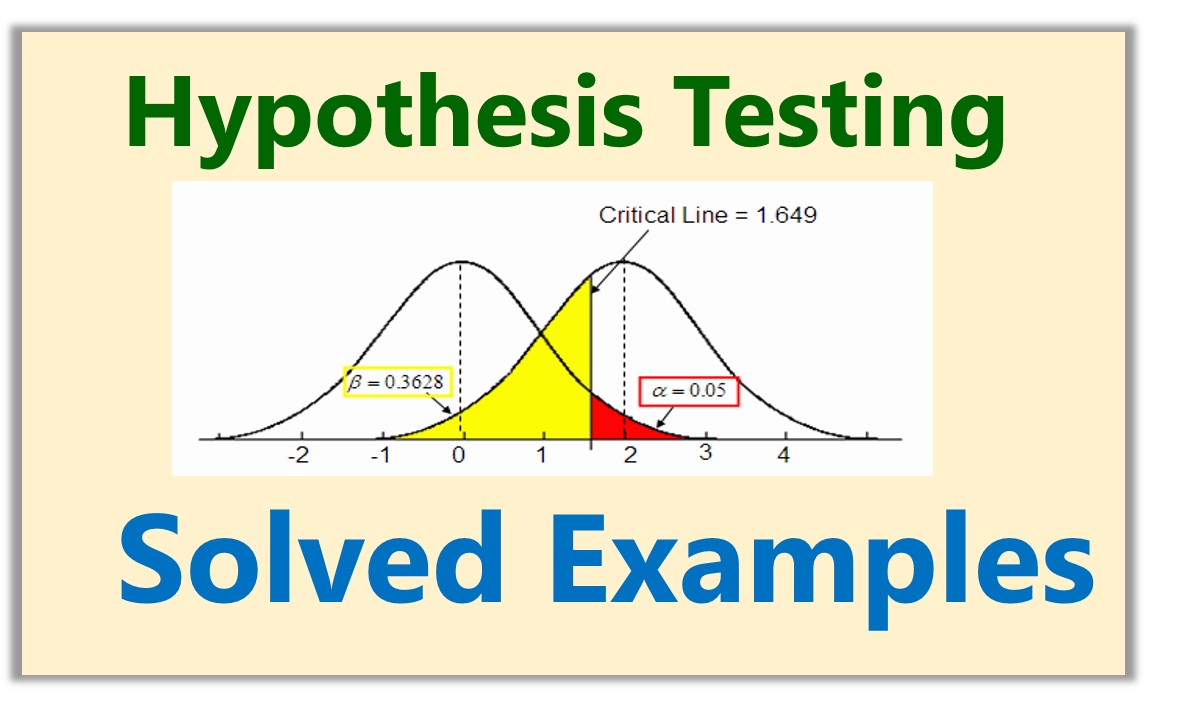
by Practice hypothesis testing with 20 solved statistics problems covering z-tests, t-tests, ANOVA, chi-square tests, non-parametric methods, and run tests. Try each question yourself first, then open the step-by-step solution.
Prerequisites: Basic statistics (mean, standard deviation, normal distribution). New to the topic? Start with Statistics Tutorial 3 — Hypothesis Testing.
Tests Covered
| Test | Questions |
|---|---|
| One-sample z / t-test | 1, 2, 8 |
| Two-sample & paired t-tests | 3, 4, 5, 6, 7 |
| Non-parametric | 9, 15 |
| ANOVA & F-test | 10, 11, 12 |
| Chi-square | 13, 14, 16, 17, 18 |
| Run test | 19, 20 |
Question 1 — One-sample z-test
In the population, the average IQ is 100 with a standard deviation of 15. A team of scientists want to test a new medication to see if it has either a positive or negative effect on intelligence, or not effect at all. A sample of 30 participants who have taken the medication has a mean of 140. Did the medication affect intelligence?
View Solution to Question 1
Question 2 — One-sample t-test
A professor wants to know if her introductory statistics class has a good grasp of basic math. Six students are chosen at random from the class and given a math proficiency test. The professor wants the class to be able to score above 70 on the test. The six students get the following scores:62, 92, 75, 68, 83, 95.
Can the professor have 90% confidence that the mean score for the class on the test would be above 70.
Solution to Question 2
Question 3 — Two-sample t-test
In a packaging plant, a machine packs cartons with jars. It is supposed that a new machine would pack faster on the average than the machine currently used. To test the hypothesis, the time it takes each machine to pack ten cartons are recorded. The result in seconds is as follows.
| New Machine | Old Machine |
| 42.1 | 42.7 |
| 41 | 43.6 |
| 41.3 | 43.8 |
| 41.8 | 43.3 |
| 42.4 | 42.5 |
| 42.8 | 43.5 |
| 43.2 | 43.1 |
| 42.3 | 41.7 |
| 41.8 | 44 |
| 42.7 | 44.1 |
Do the data provide sufficient evidence to conclude that, on the average, the new machine packs faster? Perform the required hypothesis test at the 5% level of significance.
Solution to Question 3
Question 4 — Two independent samples
We want to compare the heights in inches of two groups of individuals. Here are the measurements:
X: 175, 168, 168, 190, 156, 181, 182, 175, 174, 179
Y: 120, 180, 125, 188, 130, 190, 110, 185, 112, 188
Solution to Question 4
Question 5
A clinic provides a program to help their clients lose weight and asks a consumer agency to investigate the effectiveness of the program. The agency takes a sample of 15 people, weighing each person in the sample before the program begins and 3 months later.
The results a tabulated below

Determine is the program is effective.
Solution to Question 5
Question 6 — Paired t-test
A sample of 20 students were selected and given a diagnostic module prior to studying for a test. And then they were given the test again after completing the module. .
The result of the students scores in the test before and after the test is tabulated below.

We want to see if there is significant improvement in the student’s performance due to this teaching method
Solution to Question 6
Question 7 — Paired t-test
A study was performed to test wether cars get better mileage on premium gas than on regular gas. Each of 10 cars was first filled with regular or premium gas, decided by a coin toss, and the mileage for the tank was recorded. The mileage was recorded again for the same cars using other kind of gasoline.
Determine wether cars get significantly better mileage with premium gas.
Mileage with regular gas: 16,20,21,22,23,22,27,25,27,28
Mileage with premium gas: 19, 22,24,24,25,25,26,26,28,32
Solution to Question 7
Question 8 — One-sample t-test
An automatic cutter machine must cut steel strips of 1200 mm length. From a preliminary data, we checked that the lengths of the pieces produced by the machine can be considered as normal random variables with a 3mm standard deviation. We want to make sure that the machine is set correctly. Therefore 16 pieces of the products are randomly selected and weight. The figures were in mm:
1193,1196,1198,1195,1198,1199,1204,1193,1203,1201,1196,1200,1191,1196,1198,1191
Examine wether there is any significant deviation from the required size
Solution to Question 8
Question 9 — Wilcoxon signed-rank test
Blood pressure reading of ten patients before and after medication for reducing the blood pressure are as follows
Patient: 1,2,3,4,5,6,7,8,9,10
Before treatment: 86,84,78,90,92,77,89,90,90,86
After treatment: 80,80,92,79,92,82,88,89,92,83
Test the null hypothesis of no effect agains the alternate hypothesis that medication is effective. Execute it with Wilcoxon test
Solution to Question 9
Question 10 — ANOVA
Sussan Sound predicts that students will learn most effectively with a constant background sound, as opposed to an unpredictable sound or no sound at all. She randomly divides 24 students into three groups of 8 each. All students study a passage of text for 30 minutes. Those in group 1 study with background sound at a constant volume in the background. Those in group 2 study with nose that changes volume periodically. Those in group 3 study with no sound at all. After studying, all students take a 10 point multiple choice test over the material. Their scores are tabulated below.
Group1: Constant sound: 7,4,6,8,6,6,2,9
Group 2: Random sound: 5,5,3,4,4,7,2,2
Group 3: No sound at all: 2,4,7,1,2,1,5,5
Solution to Question 10
Question 11 — One-way ANOVA
Using the following three groups of data, perform a one-way analysis of variance using α = 0.05.
| Group 1 | Group 2 | Group 3 |
| 51 | 23 | 56 |
| 45 | 43 | 76 |
| 33 | 23 | 74 |
| 45 | 43 | 87 |
| 67 | 45 | 56 |
Question 12 — F-test (variance equality)
In a packaging plant, a machine packs cartons with jars. It is supposed that a new machine would pack faster on the average than the machine currently used. To test the hypothesis, the time it takes each machine to pack ten cartons are recorded. The result in seconds is as follows.
New Machine: 42,41,41.3,41.8,42.4,42.8,43.2,42.3,41.8,42.7
Old Machine: 42.7,43.6,43.8,43.3,42.5,43.5,43.1,41.7,44,44.1
Perform an F-test to determine if the null hypothesis should be accepted.
Solution to Question 12
Question 13
A random sample 500 U.S adults are questioned about their political affiliation and opinion on a tax reform bill. We need to test if the political affiliation and their opinon on a tax reform bill are dependent, at 5% level of significance. The observed contingency table is given below.
| favor | indifferent | opposed | total | |
| democrat | 138 | 83 | 64 | 285 |
| republican | 64 | 67 | 84 | 215 |
| total | 202 | 150 | 148 | 500 |
Question 14 — Chi-square goodness of fit
Can a dice be considered regular which is showing the following frequency distribution during 1000 throws?
| Thrown Value | 1 | 2 | 3 | 4 | 5 | 6 |
| Frequency | 182 | 154 | 162 | 175 | 151 | 176 |
Question 15 — Mann-Whitney U test
Below are the gain in weights (in lbs.) of pigs fed on two diets, A and B:
| Diet A | Diet B |
|---|---|
| 25, 32, 30, 34, 24, 14, 32, 24, 30, 31, 35, 25 | 44, 34, 22, 10, 47, 31, 40, 30, 32, 35, 18, 21, 35, 29 |
Test whether the two diets produce the same weight-gain distribution using an appropriate non-parametric test at α = 0.05.
Solution to Question 15 — Mann-Whitney U test procedure
Question 16 — Chi-square goodness of fit
A newly developed muesli contains five types of seeds (A, B, C, D and E). The percentage of which is 35%, 25%, 20%, 10% and 10% according to the product information. In a randomly selected muesli, the following volume distribution was found.
| Component | A | B | C | D | E |
| Number of Pieces | 184 | 145 | 100 | 63 | 63 |
Lets us decide about the null hypothesis whether the composition of the sample corresponds to the distribution indicated on the packaging at alpha = 0.1 significance level.
Solution to Question 16
Question 17 — Chi-square independence
A research team investigated whether there was any significant correlation between the severity of a certain disease runoff and the age of the patients. During the study, data for n = 200 patients were collected and grouped according to the severity of the disease and the age of the patient. The table below shows the result
| Age | ||||
| below 40 | 40 – 60 | above 60 | ||
| runoff | slight | 41 | 34 | 9 |
| average | 25 | 25 | 12 | |
| serious | 6 | 33 | 15 | |
Let us decided about the correlation between the age of the patients and the severity of disease progression.
Solution to Question 17
Question 18 — Chi-square independence
A publisher is interested in determine which of three book cover is most attractive. He interviews 400 people in each of the three states (California, Illinois and New York), and asks each person which of the cover he or she prefers. The number of preference for each cover is as follows:
| California | Illinois | New York | Total | |
| First Cover | 81 | 60 | 182 | 323 |
| Second Cover | 78 | 93 | 95 | 266 |
| Third Cover | 241 | 247 | 123 | 611 |
| Total | 400 | 400 | 400 | 1200 |
Table 1
Do these data indicate that there are regional differences in people’s preferences concerning these covers? Use the 0.05 level of significance.Solution to Question 18
Question 19 — Run test
Trees planted along the road were checked for which ones are healthy(H) or diseased (D) and the following arrangement of the trees were obtained:
H H H H D D D H H H H H H H D D H H D D D
Test at the 
Question 20 — Run test
Suppose we flip a coin n = 15 times and come up with the following arrangements
H T T T H H T T T T H H T H H
(H = head, T = tail)
Test at the alpha = 0.05 significance level whether this arrangement may be regarded as random.
Frequently Asked Questions
What is hypothesis testing?
Hypothesis testing is a formal procedure to decide whether sample data provides enough evidence to reject a null hypothesis (H₀) in favor of an alternative hypothesis (H₁). You compute a test statistic, compare it to a critical value or p-value, and draw a conclusion at a chosen significance level (often α = 0.05).
Which test should I use?
Use a z-test when σ is known and n is large; a t-test for means with unknown σ; paired t-test for before/after data; ANOVA for three or more group means; chi-square for categorical data; and Wilcoxon / Mann-Whitney when normality cannot be assumed.
How should I practice these problems?
Read the question, state H₀ and H₁, choose the test, work through calculations, then compare your answer with the linked step-by-step solution. Repeat until you can select the correct test without looking at the solution first. If you want to strengthen your understanding beyond practice questions, you can also explore structured statistics, data analysis, and research courses on Alkademy, an AI-powered online learning platform that combines expert-led courses, AI-assisted learning, quizzes, and practical exercises.
I am really impressed with your writing abilities as well as with the structure to your weblog.
Is this a paid subject matter or did you modify it yourself?
Either way stay up the excellent high quality writing,
it’s uncommon to look a great blog like this one these days..
Below are given the gain in weights (in lbs.) of pigs fed on two diet A and B
Dieta 25 32 30 34 24 14 32 24 30 31 35 25 – –
DietB 44 34 22 10 47 31 40 30 32 35 18 21 35 29
[…] July 12, 2026: Updated links and SEO. See also 20 hypothesis testing solved examples and hypothesis testing […]
[…] July 12, 2026: Refreshed for SEO — Question 20 (Run test). Part of the 20 hypothesis testing solved examples […]
[…] July 12, 2026: Refreshed for SEO — Question 18 (Chi-square independence). Part of the 20 hypothesis testing solved examples […]
[…] July 12, 2026: Refreshed for SEO — Question 17 (Chi-square independence). Part of the 20 hypothesis testing solved examples […]
[…] July 12, 2026: Refreshed for SEO — Question 3 (Two-sample t-test). Part of the 20 hypothesis testing solved examples […]
[…] July 12, 2026: Updated links and SEO. See also 20 hypothesis testing solved examples and hypothesis testing […]