 by
by Using the following three groups of data, perform a one-way analysis of variance using α = 0.05.
| Group 1 | Group 2 | Group 3 |
| 51 | 23 | 56 |
| 45 | 43 | 76 |
| 33 | 23 | 74 |
| 45 | 43 | 87 |
| 67 | 45 | 56 |
Read about one-way ANOVA and the steps here
Watch the video here for step by step explanation
Solutions Steps
As usual, we would transfer the table of data into MS Excel so it becomes easier to work with. The excel table is given below.
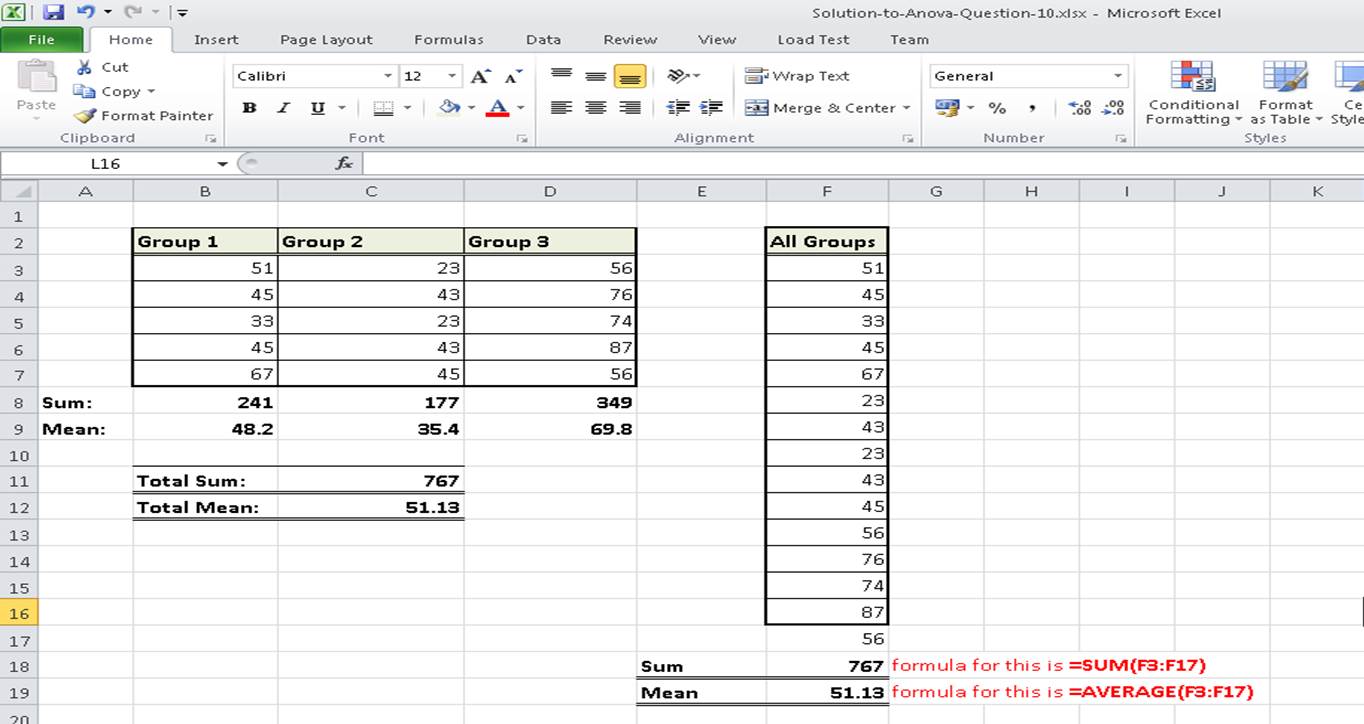
Figure 1.
Step 1: Calculate all the means
This have been done in the excel sheet as you can see in Figure 1.
Step 2: Set up the Null and Alternate Hypothesis
You should already know how to do this by now
H0: μ1 = μ2 = μ3
Ha: μ1 ≠ μ2 ≠ μ3
We also specify the as well as the rejection criteria.
α = 0.05
Rejection criteria: K0.05 < F
This means that if the critical value of F from tables is less than the calculated value of F, we reject the null hypothesis
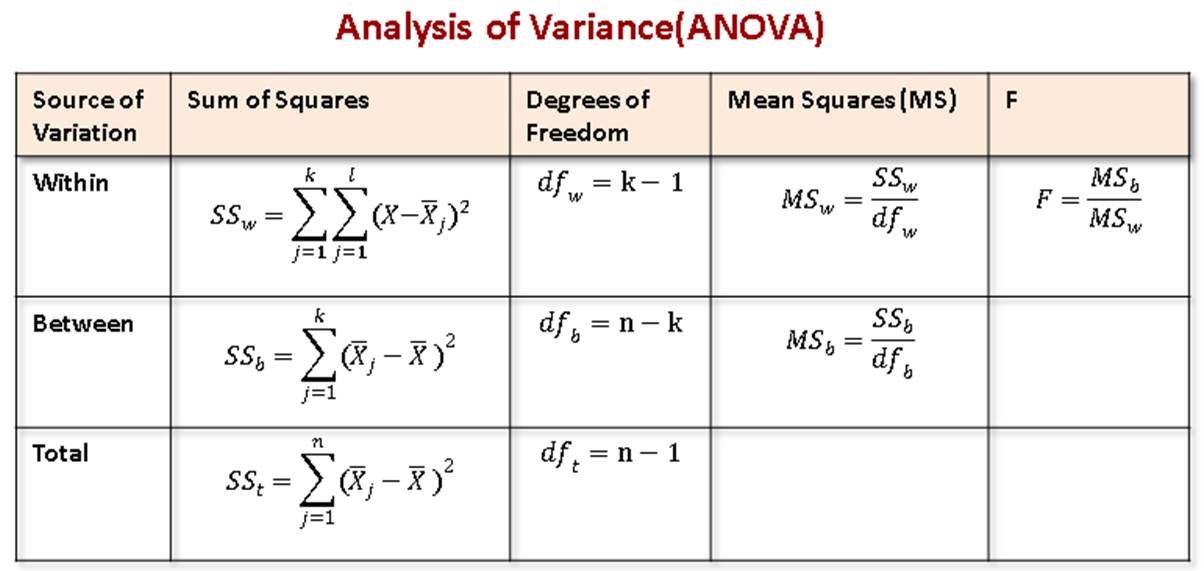
Step 3: Calculate the Sum of Squares
The formular for sum of squares are given below
I have expanded the excel sheet to calculate the values of this terms in the equation
Take some time to study it. The formulas are quite simple and clear. If you have issue though let me know in the comment box to the left of this page
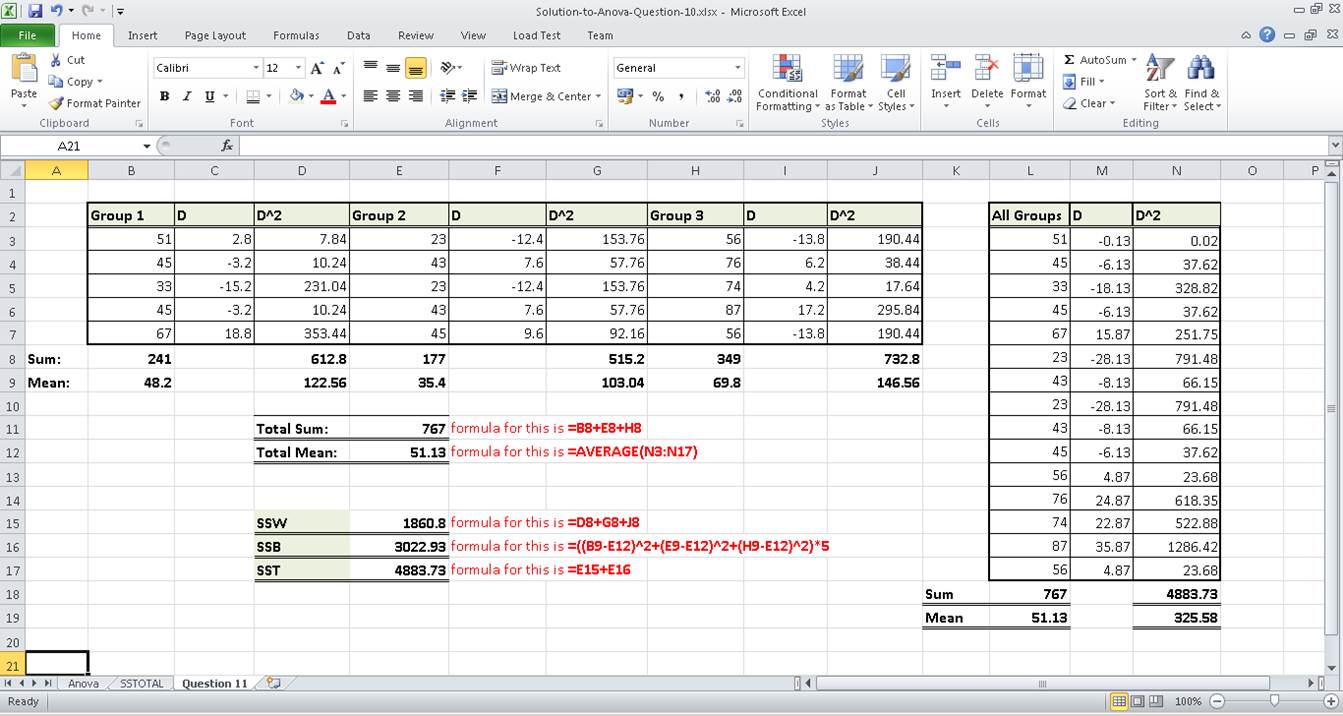
In the excel sheet above, you can verify that the total sum of squares equals to the sum of squares between and sum of squares between.
Step 4: Calculate the Degrees of Freedom
The degrees of freedom are calculated using the formula below.
dftotal = n – 1 = 15 – 1 = 14
dfwithin = n – k = 15 – 3 = 12
dfbetween = k – 1 = 3 – 1 = 2
Verify that dftotal = dfbetween + dfwithin
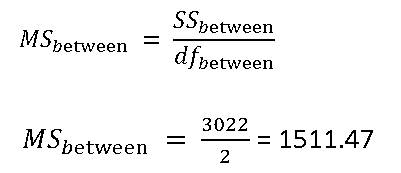
Step 5: Calculate the Mean Squares
The formula is given below for the mean squares between
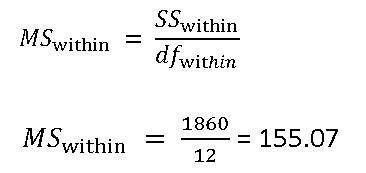
The formula for the mean squares within
Step 6: Calculate the F Statistic
Then we go ahead to calculate the F statistic using MSB and MSW
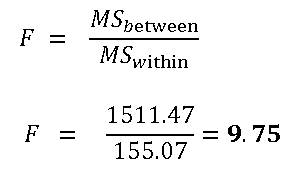
At this point, our excel sheet have been extended to calculate all the values. The formula used is written beside some of the values
Our final excel sheet would look like the one below:

Get this excel sheet from here
Step 7: Look up F from table and state your Conclusion
Access table from here
From the table of F distribution, the critical value of F for 0.05 significance and degrees of freedom of(df1 = 12 and df2 = 2) we have:
F = 3.89
Since the calculated(absolute value) of F is greater than the tabulated value, we reject the null hypothesis and conclude that at least two of the means are significantly different from each other.
Hurray!!! We are done finally! So go take a bottle of beer! Then take the quiz below
Watch the video here for step by step explanation
Try another ANOVA problem(Question 10)
Take a Simple Quiz
Complete the Anova table below with actual values from this example
If you do it, let me know in the comment box by the left of this page.
I join. I agree with told all above. We can communicate on this theme.
Typo, Step 3:
“In the excel sheet above, you can verify that the total sum of squares equals to the sum of squares BETWEEN and sum of squares BETWEEN.”
Thanks for pointing this out!
how do u calculate D in sum of squares? (step 3)
For SSB, you have *5 in the formula but I don’t see an explanation for this.
When calculating SSB, why do you multiply the sum of squares by 5? Where this 5 comes from???