
 by
by In this tutorial we are going to cover Hypothesis Testing. To understand this topic better, we would break it down into the following sub-topics
1. About Estimation
Estimation is a statistical way of trying to deduce the value of an unknown parameter. For example, to estimate the mean of a population µ, we can take a sample from the population and calculate the mean. Then we can use the sample mean as an estimate of the population mean.
Point Estimate vs Interval Estimate
A point estimate is one single number that is represents the parameter you are trying to estimate.
Interval estimates is a range of values that represents the parameter you are trying to estimate. Hence, interval estimate are often two values that define a range.
The question now is: how accurate is our estimate? We can get this by performing hypothesis testing.
2. Introduction to Hypothesis Testing
Hypothesis testing is simply a statistical way of testing an existing or null hypothesis H0(that is an estimate the is currently accepted). Therefore, to carry out a hypothesis, there must at least be an existing hypothesis. So we have to test the null hypothesis to see if it is correct.
To do this we need to formulate an alternative hypothesis Ha or H1. This is normally exactly opposite of the null hypothesis.
Let’s take example of regression from Machine Learning 101. We make an estimate of the regression coefficient β1 in case of linear regression.
Let’s state the null and alternate hypothesis:
- H0: β1 = 0
- Ha: β1 ≠ 0
To carry out hypothesis testing, we need to determine if our estimate for β1 is far enough from zero. In this case we would be confident that ≠ is non-zero.
3. Confidence Interval
How far is far enough depends on the standard error. The standard error is represented as SE(β1) in case of β1.
The standard error tells us how much our estimate differs from the actual value. In case of estimating the mean of a population
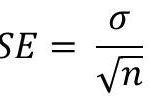
Where n is the sample size while σ is the standard deviation of the sample.
We also see that this formula show a relationship between the standard error and the sample size: the larger the sample size, the lower the standard error.
Standard errors can be used to compute confidence intervals. A 95% confidence interval means the range of values within which the the value of the unknown parameter can fall with a 95% probability. Therefore, confidence interval has an upper and lower limits.
For linear regression, a 95% confidence interval for β1 would mean:
β1 ± SE(β1)
That is 95% chance (or 0.95 probability) that the interval:
- upper: β1 + 2SE(β1)
- lower: β1 + 2SE(β1)
would contain the real value of β1
4. t-Statistic
To actually carry out hypothesis testing, we compute the t-statistic. In the case of β1, this is given by:
t = β1 / [SE(β1)]
This simply measures the number of standard deviations that β1 is away from 0. This in the case our linear regression example. The t-distribution which is assumed in this case, has a similar shape to normal distribution for n > 30.
5. p-Value
Recall that statistics relates with probability. So in case of t-statistic, we can compute the probability of observing any value that is equal to |t| or greater, assuming that β1 is 0.
This probability is what is know as the p-value.
a small value of p-value indicates that is is not likely to observe such a significant association between the X and Y (in case of linear regression) due to chance. Therefore, when a small p-value is determined, then we can conclude that there is a relationship between X and Y(the predictor and response variables). In this case, we reject the null hypothesis.


In inferential statistics, the null hypothesis is a general statement or default position that there is no relationship between two measured phenomena, or no association among groups.[1] Testing (accepting, approving, rejecting, or disproving) the null hypothesis —and thus concluding that there are or are not …
Hi. I have checked your kindsonthegenius.com and i see you’ve got some duplicate content so probably it is the reason that you don’t rank hi in google.
But you can fix this issue fast. There is a tool that generates content like human, just search in google:
miftolo’s tools
Hello. I have checked your kindsonthegenius.com
and i see you’ve got some duplicate content so probably it is the
reason that you don’t rank high in google. But you can fix this issue fast.
There is a tool that generates content like human, just search in google:
miftolo’s tools
can you explain more on the testing criteria of testing hypothesis like the level of significance
Hi,
I hope to find you in good health. I am reaching you to make an offer that can benefit both of us. I propose to publish a guest post article on your amazing website. The article will surely be of your readers’ interest and will be free of cost without compromising quality.
To proceed with this offer, I will first send over some relevant and interesting topic ideas, you can then choose the topic ideas that you think would be best to write on for your website. Eventually, I’ll provide the article and would expect you to give me a backlink inside the article’s main body.
Please let me know if I can proceed with the first step to this?
Looking forward.
Have a great day!
Regards,
Ashlie Lopez
This would be nice. Please reach me either by Facebook(https://www.facebook.com/kindsonm), Instagram(https://www.instagram.com/kindsonthegenius/), Twitter(https://twitter.com/KindsonM), or LinkedIn(https://www.linkedin.com/in/kindson/)
Amazing things here. I’m very happy to see your post.
Thanks so much and I am looking ahead to contact
you. Will you please drop me a e-mail?
[…] Do the data provide sufficient evidence to conclude that, on the average, the new machine packs faster? Perform the required hypothesis test at the 5% level of significance.Solution to Question 3 […]