
 by
by I am going to teach you how to perform one-sample t-Test, step by step using an example
Question
A research believes that the mean incom of workers in Akokwa town is 20,000 dollars. She wants to test this hypothesis against the alternative that the mean income is not equal to 20,000 naira. A random sample of 9 workers in the town is chosen, and their incomes (in dollars) turn out to be the following:
24000, 13400, 18400, 22900, 13800, 8200, 11100, 9300, 14600.
(a) If the sociologist set a 5 percent significance level, should she accept or reject this hypothesis?
(b) If she sets a 1 percent significance level, shoud she accept or reject the null hypothesis.
Solution
We would start with the first step and progress through the last step. These are the steps:
- Define the null and alternative hypothesis
- State the alpha
- Calculate the degrees of freedom
- State the decision rule (acceptance criteria)
- Calculate the test statistic
- State the results
- State your conclusion
Step 1: State the null and alternate hypothesis
The null hypothesis is the what is currently believed and needs to be tested. From the question the believe is that the mean income is 20,000 naira. Therefore
H0: mean = 20,000 naira
H1: mean ≠ 20,000 naira
Step 2: State the alpha
From the question, we have 5% significance level. This is the same as alpha level of 0.05 ( or 95% confidence). So we can state the alpha level as:
α = 0.05
Step 3: Calculate the degrees of freedom
Degrees of freedom is given as df = n-1. So in this case:
Degrees of freedom df = 9 -1 = 8
Step 4: State the decision rule (acceptance criteria)
To do this we need to look up the critical value of the t from table of t-distribution or t-Table.
In the table, the alpha is placed in the column while the degrees of freedom are on the rows. In our case we look for df of 8 under 0.05. It is normally written as:
Tcrit or T8, 0.05 = 2.306
Decision rule: Accept the null hypothesis if absolute value of t is less than 2.306 or greater than -2.306
We can do a little sketch to illustrate this in Figure 1.0. Note that the 5% has been divided into two parts of 2.5% on both sides of the graph
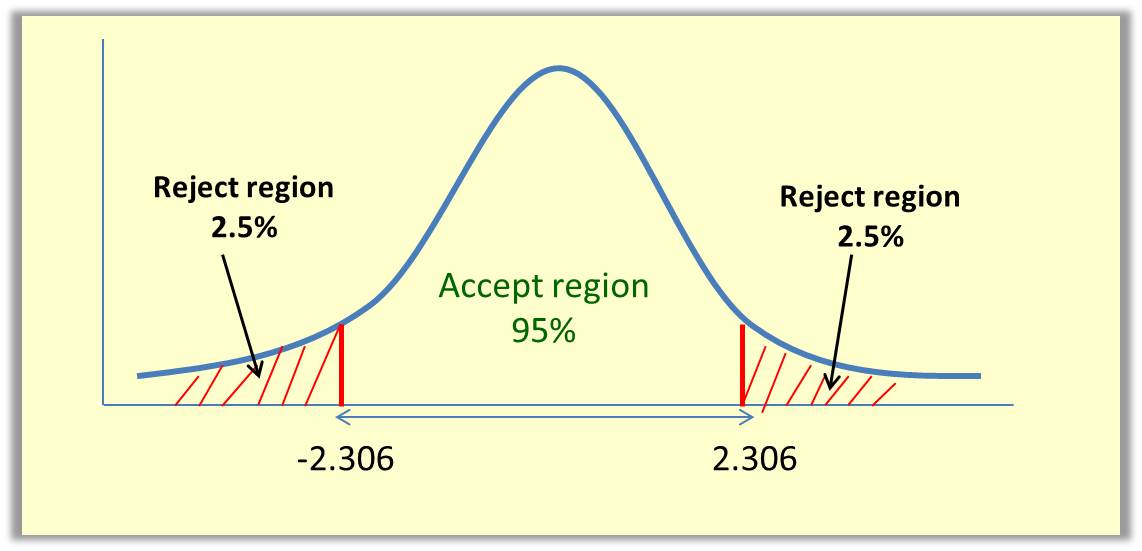
Figure 1.0: Sketch of Accept and Reject region
5. Calculate the test Statistic (Absolute value of t)
The formula for the test statistic is given by:
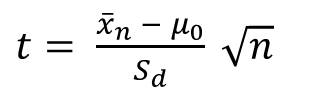
where:
xn is the mean(we need to calculate it)
μ0 is the mean to be tested (given in the question – 20,000)
sd is the standard deviation of the sample (we need to calculate it)
n is the number of elements, in this case it is 9
xn = Sum/9
Sum = 24000+ 13400+18400+22900+13800+ 8200+11100+9300+14600
Sum = 135700
xn = 135700/9 = 15077.78
sd = 5623.78
Note: Standard deviation is sum of squared deviation divided by n.
Using the formula for t, we can calculate the value of t as:

Step 6: State your results
The value of t is -546.93 and the decision rule states that the the null hypothesis is accepted if the value of t is less than 2.306 or greater than -2.306.
In this class t is not greater than 2.306 and therefore, the test has failed.
Result: We reject the null hypothesis, H0
Step 7: State your conclusion
From the result, our conclusion would be that the mean income of workers in Akokwa town is not 20,000 dollars
If you follow these steps in your statistics quiz, then you are sure to make the maximum grade for How to Perform t-Test.
Success in your exams and thanks for your efforts!

Hello. I have checked your kindsonthegenius.com and i see you’ve got some duplicate
content so probably it is the reason that you don’t rank high in google.
But you can fix this issue fast. There is a tool that creates content like human, just search
in google: miftolo’s tools