 by
by Can a dice be considered regular which is showing the following frequency distribution during 1000 throws?

| Thrown Value | 1 | 2 | 3 | 4 | 5 | 6 |
| Frequency | 182 | 154 | 162 | 175 | 151 | 176 |
Solution Steps
In this case, the questions says to consider whether the dice can be considered regular(consistent). So we use Chi-Square goodness of fit test which is used to determine whether a smple data is consistent with a distribution.
Watch the video explanation here
Get the excel sheet for this question
The formular for chi-square is

where
O = Observed values
E = Expected value
Step 1: State the Null and althernate hypothesis
H0: the data is consistent with a specified distribution
Ha: the data is not consistent with a specified distributions
Step 2: Create the Table
I have tranfered the data to excel and created the table as shown in Table 1.
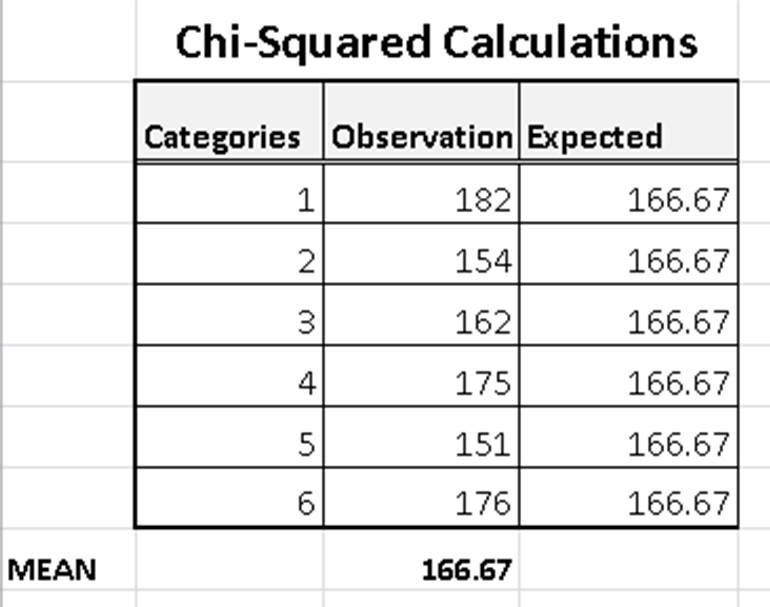
Step 3: Calcualte the Expected Value (E)
The expected value is the same as the mean of the sample which I have calculated as shown in the table.
E = 166.67
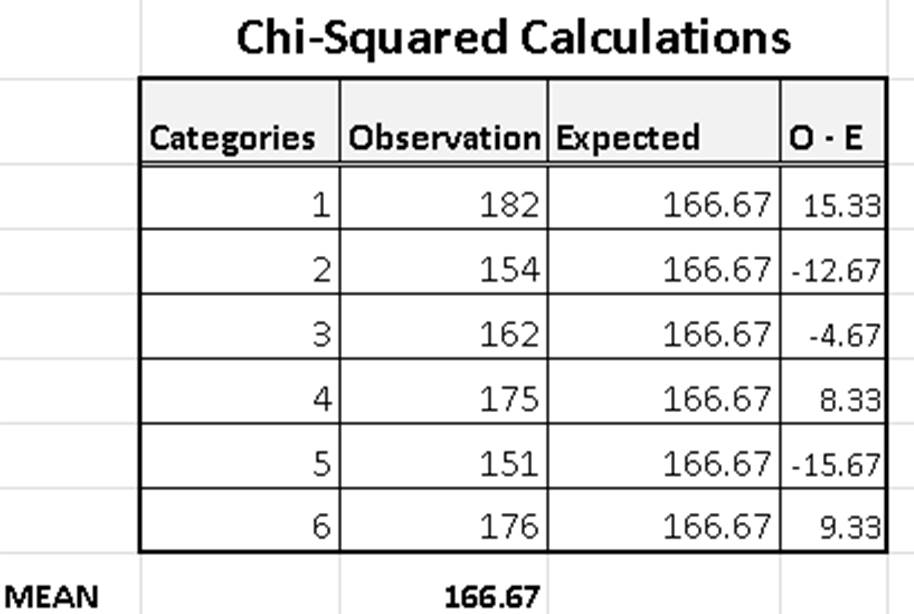
Step 4: Calculated the Differences
In this step, you need to calculate the Observed Value – Expected Value (O-E) for each of the obseravtion. This I have done and added additional column to the table.
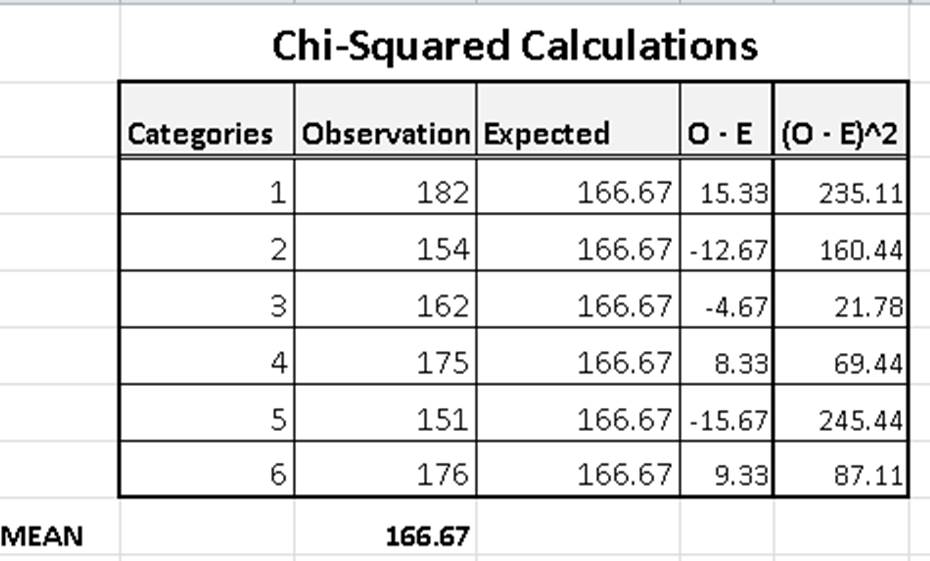
Step 5: Calculate the Squared Differences
This is simple the square of the differences calculated in Step 4. I have added another column to our table to hold the squared differences.
Step 6: Calculate the Component
This is calculated by dividing the squared difference calculated in step 5 by the expected value for each of the value.
Our table has been updated to include this column as well as the sum of this column
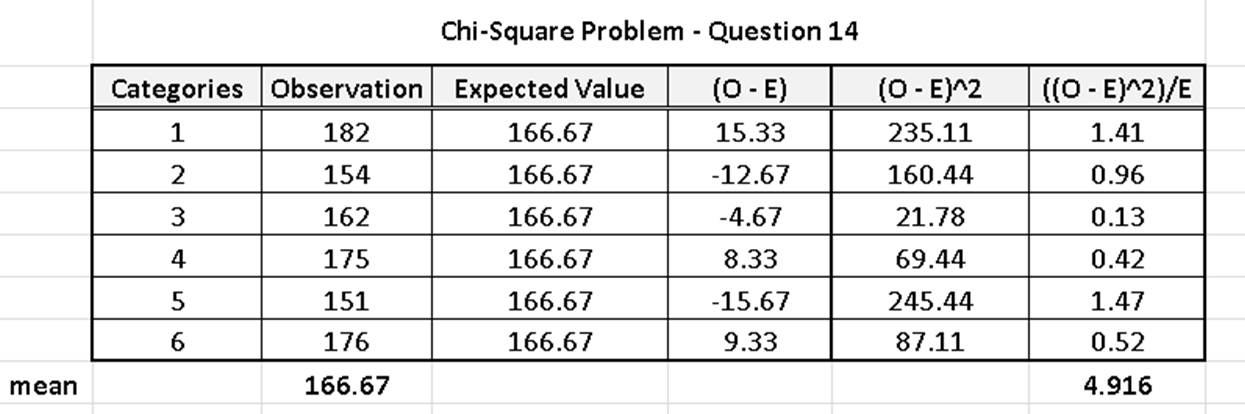
Step 7: Calculate the Chi-Square Statistic
The chi-square statistic is calculated as the sum of the last column in our table which is the same as the result of using the formula
Chi-Square Statistic = 4.92
Step 8: Find the P-Value from Tables
You can find the p-value using the calculate chi-square statistic and the degrees of freedom
Degrees of freedom is given by N-1
df = 6 – 1 =5
where N is the number of observation. In this case
From the chi-square table we for α = 0.05, df = 5
get a p-value of 11.07
Step 9: State your Conclusion
In this case the calculated test statistic from the sample which is 4.92 is less than the critical value from the table which is 11.07.
Therefore we accept the null hypothesis
